The Research Ladder
Q·01
What is the economic lifetime of an airport display?
Q·02
How does the choice of display technology affect the value created, the cost incurred, and the knowledge preserved throughout its lifetime?
Q·03
Can MicroLED change the economic role of an airport display — from equipment to digital infrastructure?
The Framework
We define the life of a display in eight stages — and ask it the same seven questions.
From planning to renewal, every stage of an airport display's life is interrogated through one constant lens. The number of the stage is real sequence; the seven questions are the instrument.
①What exists today?
②Who controls it?
③What travels, when the system changes?
④What is lost, as the equipment ages?
⑤Who reconstructs it, when it fails?
⑥Can the system use new technology?
⑦What remains unresolved?
- 01
Planning 策划
Why does the airport need this surface?
- 02
Procurement 采购
What is bought — and by which metric?
- 03
Realization 实现
How is it installed, commissioned, delivered?
- 04
Operation 运行
What does running it cost, every day?
- 05
Maintenance 维护
What happens when part of it fails?
- 06
Content & Commercialisation 内容与商业化
How does the surface earn its keep?
- 07
Preservation & Adaptation 保存与适应
Will it still work in five to ten years?
- 08
Re-exhibition / Renewal 更新
Replace, upgrade, or reimagined?
Case Study — HKIA
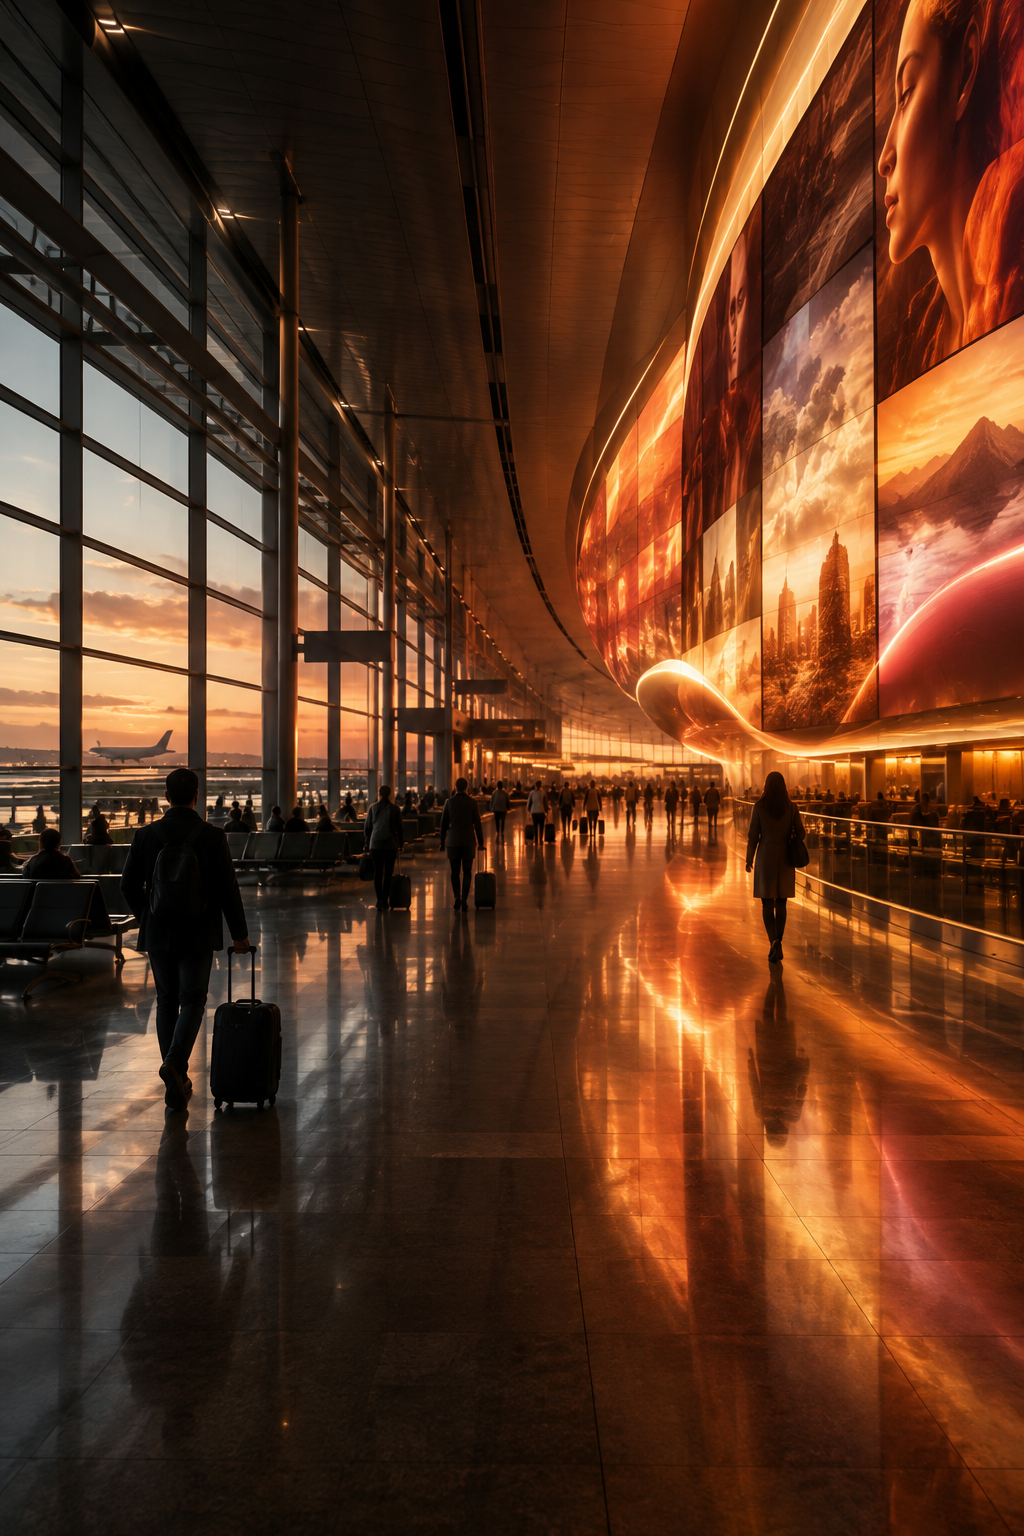
Hong Kong International Airport is already becoming a digital visual environment.
This is not a forecast of what airports might need. It is a description of what HKIA is already building — a live laboratory for airport digital infrastructure.
63.0M
passengers, FY2025/26, +14.7% YoY
[2]T2 · 2026
opened with large-format, multi-shape LED & 3D ocean-themed content
[3]120M
designed annual passenger capacity after 3RS
[4]
Hong Kong Airport is a working "Airport Digital Infrastructure Laboratory."
Stage 02 — Procurement
From cost-per-square-metre, to value-per-square-metre over a lifetime.
Traditional procurement
Compare LCD, LED and MicroLED, and ask only: which quote is lower?
LCDLEDMicroLEDPrice per m²
Lifecycle procurement
Initial CAPEXInstallationEnergy
CoolingMaintenanceSpare parts
CalibrationDowntimeContent limitation
Replacement
→ 10-year total cost of ownership.
The Value Model
Airport Display Lifetime Value
A TCO model only studies cost. A display, like any infrastructure, should be studied as cost and value.
LTV —
Commercial Value
+Operational Value
+Experience Value
+Space Value
+Energy Savings
+Maintenance Savings
+Downtime Avoidance
+Residual Value
−CAPEX
Stage 03 — Realization
From panels to one programmable surface.
LCD video wall
- Panel
- Bezel
- Structure
- Controller
- Calibration
- Replacement
Direct view LED / MicroLED
- Module
- Continuous surface
- Processing
- Calibration
- Content
Visual Continuity — an LCD wall is a row of independent devices. MicroLED can be understood as one programmable surface composed of serviceable modules. The real unit of comparison is not "the price of one panel," but the lifetime cost of one square metre of continuous digital surface.
Stage 04 — Operation
A 100 m² display, running twenty hours a day.
This is a scenario model, not measured HKIA data — built to show how the sensitivity analysis should work, using the 2026 CLP average net tariff of roughly HK$1.406/kWh. [5]
LCD
Traditional LED
MicroLED
Average power
250 W/m²
300 W/m²
180 W/m²
Area
100 m²
100 m²
100 m²
Operation
20 h/day
20 h/day
20 h/day
Est. annual energy cost
≈ HK$257,000
≈ HK$308,000
≈ HK$185,000
Difference, Traditional LED vs. MicroLED: ≈ HK$123,000 / year → ≈ HK$1.23M over ten years.
This is a sensitivity scenario, not a claim that MicroLED saves HK$1.23M over ten years. A real model must add brightness, APL, content type, operating schedule, dimming, power-supply efficiency, ambient temperature and HVAC load.
A Larger Cost
The bigger number may not be electricity at all.
Downtime Cost > Energy Cost
A twelve-hour failure on a commercial surface may not cost electricity. It costs:
Advertising inventoryBrand exposurePassenger communication
Campaign commitmentEvent activation
Stage 05 — Maintenance
Not "does it fail" — how does it behave when part of it does?
LCD
- Panel failure
- Replace panel
- Ageing mismatch
- Brightness mismatch
- Colour mismatch
- Recalibration
- Possible visual discontinuity
Modular LED / MicroLED
- Module failure
- Front-service access
- Replace module
- Calibrate
- Return to service
Proposed Metric
MTTVR — Mean Time to Visual Recovery. After a fault, how long until the surface returns to an acceptable visual state?
Stage 06 — Commercialisation
The display is entering media infrastructure.
In 2026, AAHK issued RAD/26-019, inviting operators to develop T1 and T2 advertising concessions — explicitly through innovative media formats, advanced technology and high-impact media assets. [6]
If 100 m² runs twenty hours a day, that is 7,300 hours a year. If only 20% carries commercial content, that is 1,460 hours — or 146,000 m²·hours/year of media inventory a surface like this can create.
Hypothesis
The economic value of an airport display may be determined less by its acquisition cost than by its ability to generate, host and adapt commercial media inventory throughout its lifetime.
Content — One Surface, Many Identities
The same physical surface can hold multiple economic identities in a single day.
Earth LinC's research on digital artworks asks: AI has entered the moment of creation — what happens when it enters every other stage of a work's life? [1] Moved to the airport, the question becomes: content adapts by language, passenger profile, time, weather, destination, campaign and retail activity. AI doesn't just generate the image — it continuously optimises what the surface is doing.
Stage 07–08 — Preservation & Renewal
Economic lifetime, not physical lifetime.
A screen may work for ten years. Its economic lifetime may end at six — not because it fails, but because resolution, processing, content formats and brightness requirements move on without it. A modular, upgradable architecture lets a surface keep repairing itself in place, rather than being retired all at once.
Three ROI Models
Not one comparison — three.
Model A
LCD → MicroLED
Core: TCO
- CAPEX
- Energy
- Maintenance
- Replacement
- Downtime
Model B
Traditional LED → MicroLED
Core: Performance-adjusted TCO
- Pixel density
- Image quality
- Viewing distance
- Brightness & colour
- Reliability
- Power & serviceability
Model C
Display → Digital Infrastructure
Core: Lifetime value
- Operational value
- Media value
- Experience value
- Advertising value
- Space & energy value
- Future-upgrade value
A Proposed Index
LDS — Lifetime Digital Surface Value
Not simply profit over investment — a measure that holds commercial, operational, experiential and resilience value against lifetime cost.
LDS —
( Commercial + Operational + Experience + Energy + Maintenance + Resilience )
÷Lifetime Cost
Not "Which Is Best" — Three Open Questions
01
When does a display stop being equipment and become infrastructure?
02
How should an airport account for the commercial and experiential value a digital surface creates?
03
Can modular maintenance, long economic life and programmable content turn visual space into a long-term digital asset?
Next
Beyond the Screen
The Lifetime of an Airport Digital Surface — a research study on MicroLED, digital infrastructure and the economics of visual space. Next: a full HKIA 100 m² demonstration model — a ten-year ROI / TCO matrix comparing an LCD video wall, a traditional fine-pitch LED wall and MicroLED, across CAPEX, installation, energy, HVAC, maintenance, spares, calibration, failure rate, downtime, replacement cycles, content flexibility, advertising inventory, media revenue, passenger exposure, carbon, residual value, NPV, payback period and IRR.
Next: The 10-Year ROI / TCO Matrix